College football's year of the middle class ultimately gave way to the game's wealthy programs.
At one point, Mississippi State, Baylor, TCU and Arizona State all threatened to make the College Football Playoff despite athletic revenue that ranked 36th or lower nationally (based on 2012-13 figures). Instead, the first CFP has, in terms of revenue, No. 3 Alabama, No. 5 Ohio State, No. 9 Oregon and No. 26 Florida State.
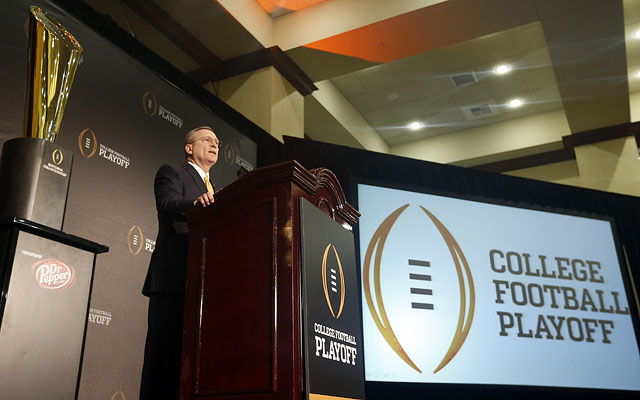
How do the inaugural four CFP schools make and spend their money? CBSSports.com broke down each school's 2012-13 NCAA financial reports and other documents for answers. Financial reports from 2013-14 are not available yet. Unless otherwise noted, all of the figures below are from 2012-13 figures the schools reported to the NCAA.
| Looking at the College Football Playoff Teams | ||||
| Category |  Alabama |
 Ohio State |
 Oregon |
 Florida State |
| Total Revenue | $143,776,550 | $139,639,307 | $115,271,040 | $91,382,441 |
| Athletic Revenue Increase (2005-13)* | $81,489,358 | $49,938,328 | $75,264,435 | $34,805,508 |
| Sports/Number of Athletes | 21 sports/563 athletes | 36 sports/1,003 athletes | 19 sports/454 athletes | 20 sports/515 athletes |
| Annual Debt Service for Athletic Facilities (pct of university's total annual debt service used for athletics) |
$15,980,449 (30%) | $15,882,000 (5%) | $19,243,594 (34%) | $0 (0%) |
| Potential Cost of Attendance Stipend to Players | $4,332 (in-state) $5,662 (out) |
$4,691 (in-state) $5,411 (out) |
$2,430 (in-state and out-of-state) |
$4,124 (in-state) $5,720 (out) |
| Football Ticket Sales | $36,199,233 | $46,317,719 | $21,604,651 | $17,611,185 |
| Donations to Athletic Department | $34,233,035 | $22,204,606 | $46,627,597 | $18,894,097 |
| Direct Institutional Support | $5,791,200 | $0 | $0 | $0 |
| Student Fee Revenue | $0 | $0 | $1,524,045 | $7,859,734 |
| NCAA/Conference Payouts | $23,855,929 | $23,635,519 | $19,123,125 | $19,814,702 |
| Broadcast, TV, Radio, Internet Rights | $10,926,979 | $1,962,000 | $120,000 | $355,000 |
| Royalties, Licensing, Advertising and Sponsorships | $11,203,182 | $12,714,758 | $7,139,035 | $11,859,646 |
| Football Camp Revenue | $584,616 | $574,771 | $248,312 | $0 |
| Nike 2014-15 Contract Value | $3,570,000 | $4,164,014 | $2,985,000 | $4,400,000 |
| Football Scholarship Costs | $3,632,607 | $3,243,001 | $3,057,727 | $3,120,676 |
| Football Coach Pay* (From 2014) | Nick Saban $7,160,187 |
Urban Meyer $4,536,640 |
Mark Helfrich $2,000,000 |
Jimbo Fisher $3,591,667 |
| Football Coach CFP Bonuses | $200,000 (semifinal appearance) or $300,000 (championship appearance) or $400,000 (championship win) |
$200,000 (semifinal appearance) or $250,000 (championship appearance) |
$175,000 (semifinal appearance) or $200,000 (championship appearance) |
$75,000 (semifinal appearance) $200,000 (championship game appearance) $200,000 (championship win) |
| Football Assistant Coaches Pay* (2014) | $5,213,400 | $3,592,025 | $3,277,584 | $3,386,000 |
| Football Support Staff Pay | $2,896,666 | $2,587,481 | $1,481,515 | $1,141,275 |
| Football Recruiting Expenses | $983,721 | $564,152 | $674,755 | $425,796 |
| Athletic Department Medical Expenses/Insurance | $2,346,604 | $1,787,936 | $1,216,954 | $1,483,445 |
| Athletic Department Money Transferred to University | $5,934,130 | $8,279,172 | $0 | $3,706,921 |
* - Numbers from USA Today